
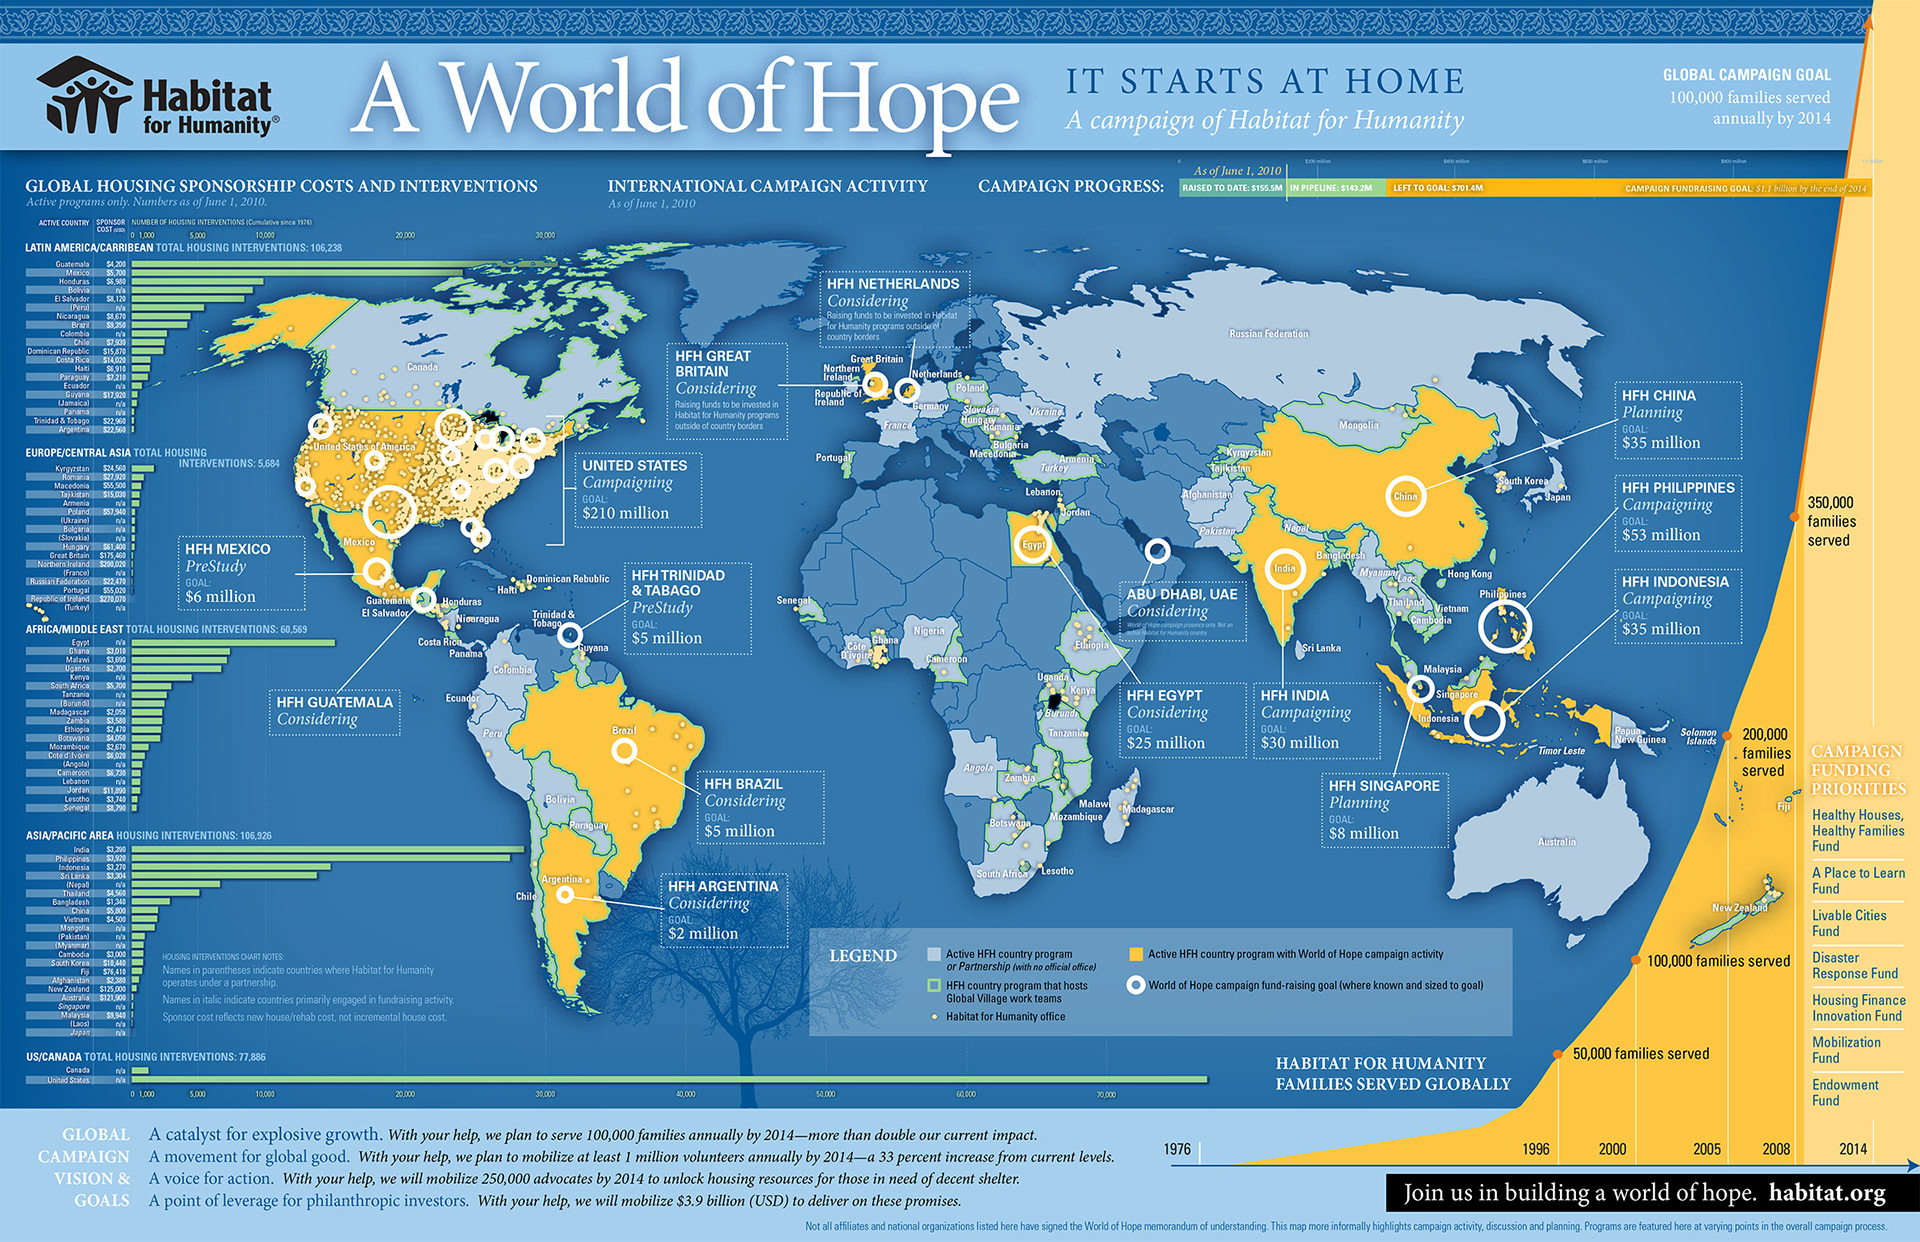
Campaign "super graphic" showing fundraising goals and progress, people served, locations, revenue over time and active country information. Built to automatically update based on linked files and through GIS data.
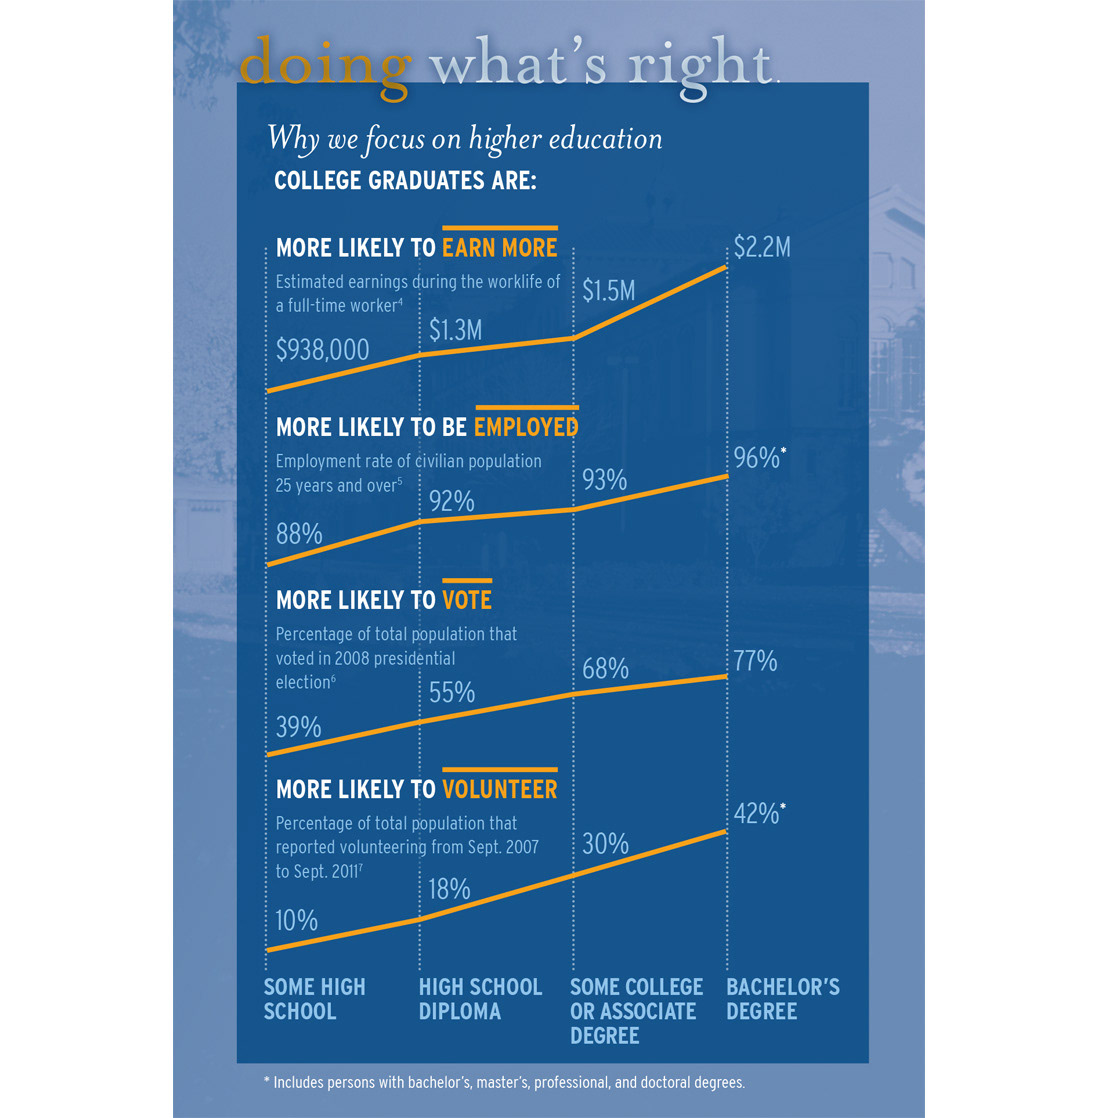
Education outcomes graphic

Editorial information graphics
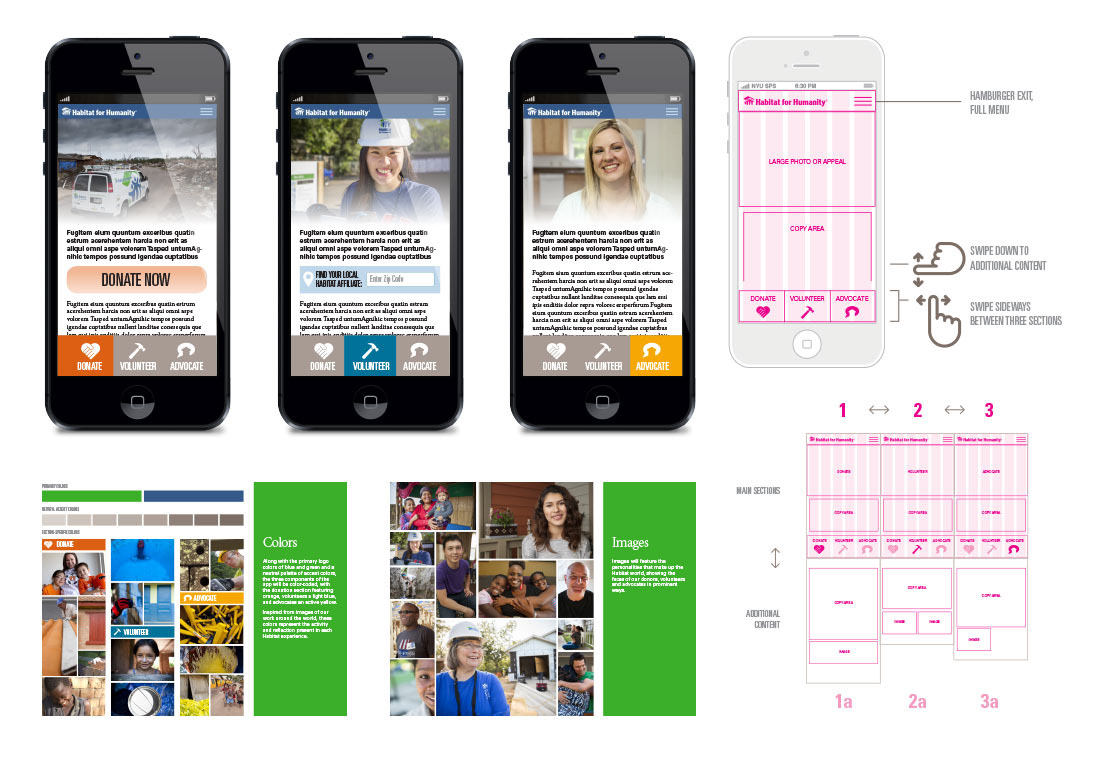
Presentation graphics, including wireframing and concept background (student project)
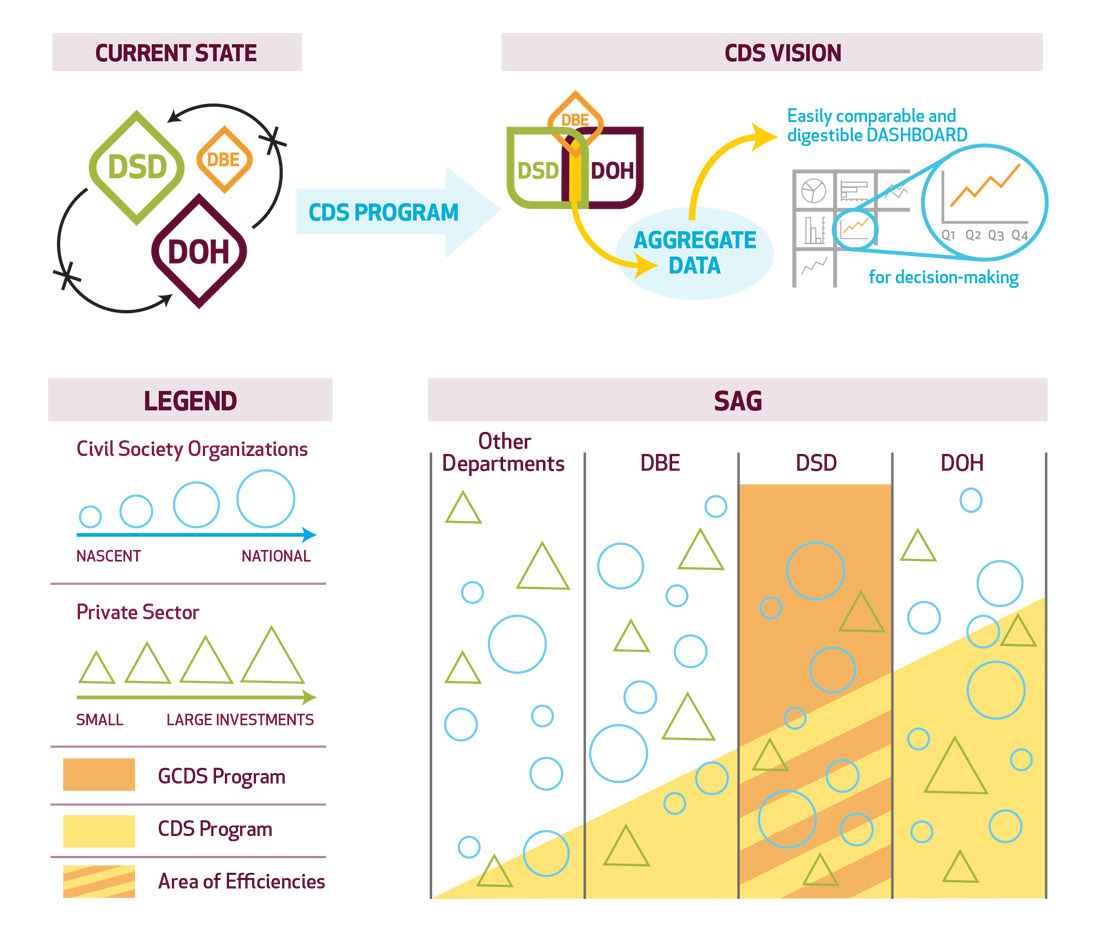
Diagrams of complex programs